Strategic Market Analysis Report: Turkey's Export of Adhesives
Executive Summary
This report analyzes Turkey's export performance for commodity code 350691909019 from January to December 2025, comparing it to the same period in 2024. The data reveals a significant surge in global demand, with total export value increasing by 47.74% to USD 86.91 million and volume increasing by 52.28% to 33.93 million kilograms. This growth is primarily driven by a dramatic expansion in the Asia market, which saw a 172% increase in value. While Europe remains the largest market by share (48.57%), its growth is moderate (40%). The analysis identifies key opportunities in emerging markets within Asia, the Caucasus, and Central Asia, while also highlighting concentration risks in the top customer, Russia, and potential volume-price trade-offs in certain regions.
1. Global Market Overview: Key Structural Shifts
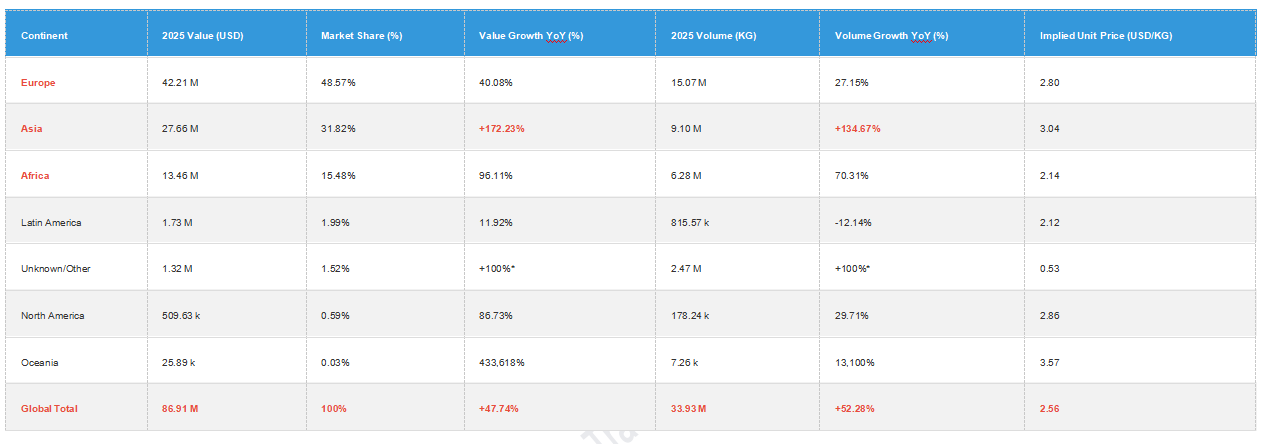
The global market for this product experienced a structural rebalancing in 2025. The most significant change is the rapid ascendance of Asia as a growth engine, closing the gap with the traditional dominant market, Europe.
Table 1: Global Market Distribution and Growth by Continent
Key Driver Identification & Structural Change:
·Primary Growth Driver: Asia's Explosive Demand. With a 172% increase in value, Asia is the primary engine of global growth. This is not just volume-driven (134.67% increase) but also price-supported, as Asia commands a higher average unit price (USD 3.04/KG) than Europe or Africa.
·Volume vs. Value Disparity in Latin America: A critical risk signal. While value grew slightly (11.92%), volume decreased by 12.14%. This indicates a significant price increase per unit in this market, which could be due to a shift toward a higher-value product mix or, more likely, a short-term price hike that is not sustainable for volume growth.
·Emergence of "Unknown" Markets: The appearance of USD 1.32 million in trade with unspecified destinations is a notable development. This could represent trade with new, undesignated entities or logistical complexities. This segment requires closer monitoring for potential compliance or channel risks, despite its high growth rate.
2. Destination Country Analysis: Identifying Core Markets and Opportunities
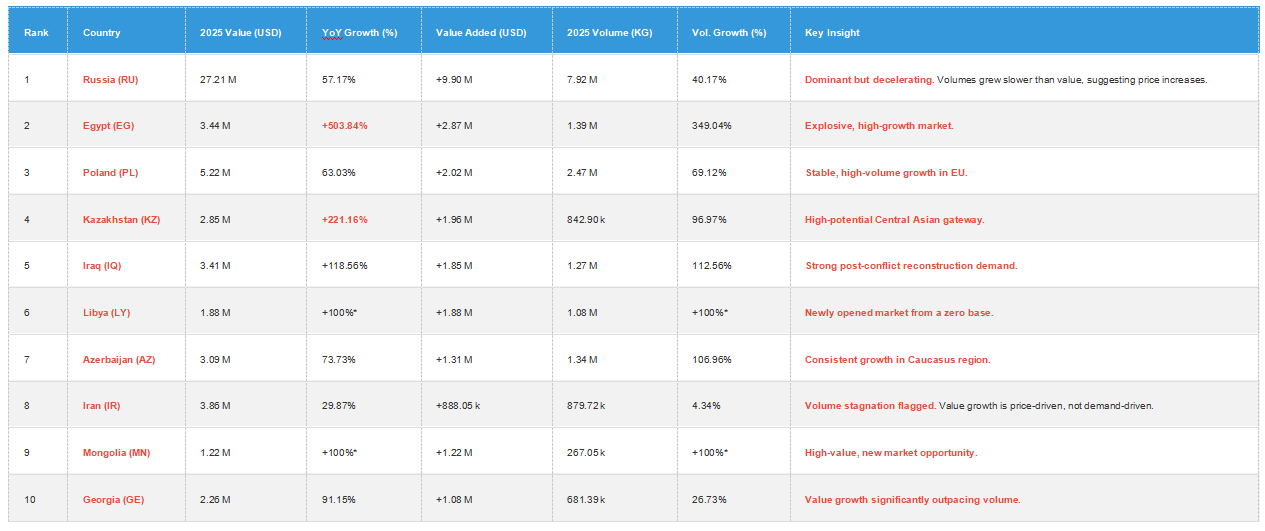
Turkey exports to 186 destination countries, but growth is highly concentrated. Understanding the dynamics of top-performing countries is crucial.
Table 2: Top 10 Destination Markets by Value Growth Contribution (2025)
Partner Assessment & Risk Evaluation:
·Critical Partner – Russia (RU): Russia is the single most important market, accounting for 31.31% of total export value. While growth is strong, this represents a high concentration risk. The monthly data shows high volatility (e.g., 36.99% month-on-month drop in June). Any geopolitical or economic disruption in Russia would severely impact total export performance.
·High-Growth Frontier – Egypt (EG) & Kazakhstan (KZ): These markets show explosive growth from a smaller base. Egypt (+504%) and Kazakhstan (+221%) are key frontiers for market expansion. The product appears to be finding new industrial or consumer applications in these regions.
·Volume Concern – Iran (IR): Despite a 30% value increase, volume growth is almost flat (+4.34%). This is a classic sign of a market reaching saturation or facing price sensitivity. Exporters may be maximizing short-term profits but risk losing volume share to competitors.
·New Market Exploration – Libya (LY) & Mongolia (MN): These markets opened in 2025 from a zero base in 2024. Mongolia's high average price (USD 4.57/KG) suggests a premium product application, while Libya's lower price (USD 1.74/KG) indicates a more commodity-focused demand.
3. Price and Volume Dynamics: A Closer Look at Top Markets
Analyzing the trend of price and volume for the top 10 markets reveals important strategic nuances.
Table 3: Monthly Price & Volume Trends for Top 3 Markets (Key Months)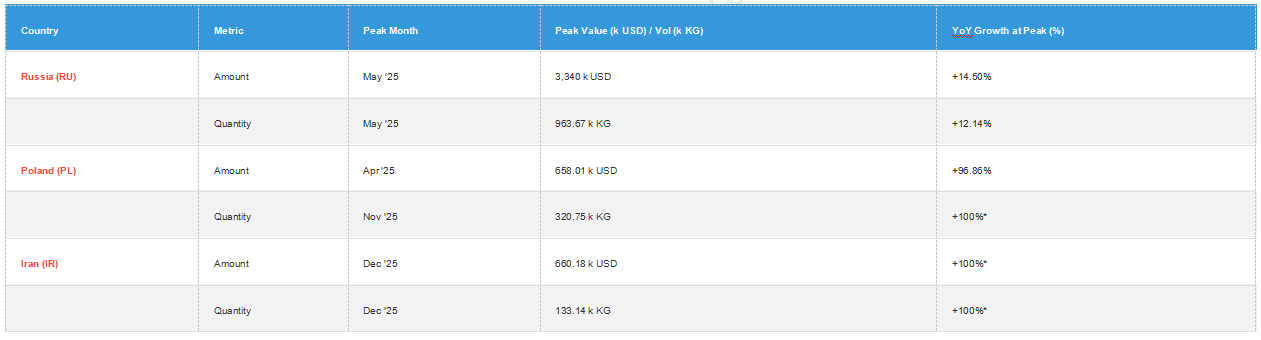
Predictive Analysis:
·Russian Demand Plateaus: The peak in May followed by a significant drop in June (-36.99% value) and a slower recovery suggests a potential ceiling in monthly demand. Future growth may depend on capturing a larger share within a stable market rather than relying on overall market expansion.
·Polish Demand Resilience: Poland shows consistent high-volume months (e.g., Nov '25). It functions as a stable, high-volume, and growing market within the EU. Its value and volume growth are well-aligned, signaling a healthy, demand-driven market.
·Iranian Price Over Volume: The peak in Iran (Dec '25) is driven almost entirely by price recovery from a very low base, not volume. The volume at its peak (133.14k KG) is lower than in other markets. This market is less attractive for volume-focused expansion.
4. Product-Level Performance
The analysis covers a single customs code, 350691909019. Its overall performance mirrors the macro trends.
Table 4: Annual Product Performance

The product's value and volume growth are closely linked, but volume is growing slightly faster (52% > 48%). This implies a slight decrease in average global unit price, from ~USD 2.64/KG in 2024 to ~USD 2.56/KG in 2025, suggesting a move towards more price-sensitive volume-driven markets like Africa and parts of Asia.
5. Strategic Recommendations
Based on the data analysis, the following strategic actions are recommended:
1.Mitigate Russia Concentration Risk: Actively diversify the customer portfolio in other high-growth markets like Egypt, Kazakhstan, and Poland to reduce dependency on the volatile Russian market. Consider establishing local partnerships or distribution hubs in these regions.
2.Prioritize Expansion in Asia and Central Asia: The structural shift towards Asia is clear. Allocate more marketing and sales resources to target markets like Kazakhstan (as a hub for Central Asia), Iraq, and Mongolia. The high average price in Mongolia suggests a specific high-value application.
3.Develop a Specific Pricing Strategy for Markets like Iran and Latin America: For markets showing volume stagnation or decline (Iran, Latin America), a volume-focused strategy is risky. Instead, focus on value-added product differentiation to justify higher prices or implement a selective engagement strategy to protect margins.
4.Investigate the "Unknown" Territories: The USD 1.32 million in trade with unknown destinations is a significant data point. Efforts should be made to clarify the nature of these transactions to ensure channel transparency, regulatory compliance, and to potentially unlock a new, unclassified market segment.
5.Monitor Global Unit Price Trends: The slight decline in the average unit price requires ongoing vigilance. If this trend continues, it could compress margins, especially in Europe. A strategy shift toward higher-value product variants or premium service offerings (e.g., logistics, technical support) could help maintain profitability in the face of price commoditization.
Conclusion
2025 represented a year of exceptional growth for Turkish exports of code 350691909019, driven by a powerful expansion in Asia and the Middle East. While the dominance of Russia remains a key pillar, the top-line growth is now increasingly supported by a more diverse portfolio of emerging markets. The primary strategic challenge is to manage the transition from a Russia-centric model to a more geographically balanced and resilient global portfolio, while defending margins in slower-growth regions.