Strategic Market Analysis: Vietnam's Export of HS Code 09041120 (2025)
Executive Summary
In 2025, Vietnam's export of HS code 09041120 reached $1.10 billion USD, a 21.68% year-on-year increase in value, despite a 12.13% decrease in volume to 84.64 million kg. This divergence—higher value with lower volume—signals a significant structural shift towards premiumization and higher unit prices.
The market is undergoing a geographic rebalancing. While Asia remains the dominant market (53.4% of value), its growth is shifting from traditional hubs like Hong Kong to emerging giants like China and India. Simultaneously, Africa has emerged as a high-growth, high-potential frontier. Conversely, mature markets in North America and Latin America are experiencing a notable contraction.
Key Findings:
·Value Growth Drivers: Export value growth is primarily driven by a surge in unit prices. The average price per kg increased from ~$9.45 in 2024 to ~$13.00 in 2025.
·Volume Decline: The overall volume decline is concentrated in the US, Latin America, and Hong Kong, offsetting the volume increase to China and India.
·Strategic Opportunity: The simultaneous boom in China (+302% value) and India (+83% value) presents a powerful dual-engine growth opportunity.
·Key Risk: Over-reliance on price-sensitive markets and the sharp decline in major traditional buyers like the US, Hong Kong, and the Netherlands pose a risk to trade stability.
1. Global Market Structure & Key Drivers
The global market for HS 09041120 is defined by a clear value-up, volume-down trend. The key drivers are identified below.
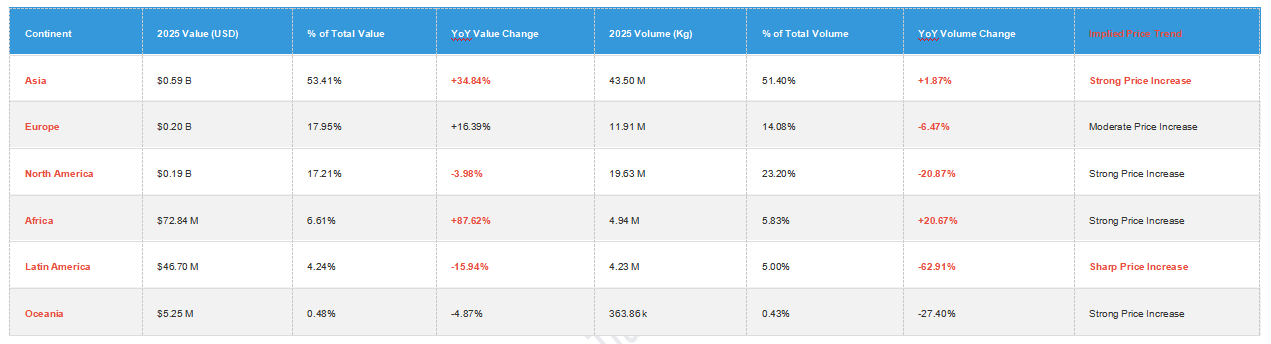
Table 1.1: Global Export Performance by Continent (Value & Volume Change 2024-2025)
Key Drivers & Structural Changes:
1.Premiumization is the Primary Driver: The global trend is a shift towards higher-value transactions. Exporters are moving away from bulk, low-margin shipments. This is most evident in North America and Latin America, where volumes dropped sharply ( -20.87% & -62.91% ), but value only fell slightly (-3.98%) or less than volume, indicating a move towards higher-quality grades or packaged products.
2.Asia's Dual-Engine Growth:
·China's Rebound: A massive 302% value increase and 223% volume increase signal a resurgent demand from the world's largest market, likely driven by post-pandemic economic recovery and strategic stockpiling.
·India's Sustained Demand: An 83% value increase with a 22% volume increase confirms India’s structural transition into a major consumer, not just a transshipment hub.
3.Africa's Emergence as a High-Growth Frontier: Africa is the fastest-growing continent by both value (+87.62%) and volume (+20.67%). This represents a significant, previously under-penetrated market.
4.Mature Market Contraction: The decline in value and volume to North America (-3.98% value, -20.87% volume) and Latin America (-15.94% value, -62.91% volume) suggests a shift in demand, increased competition, or trade diversification away from these regions.
2. Strategic Assessment of Key Partner Markets
An analysis of the top markets reveals divergent trajectories and partnership opportunities.
Table 2.1: Top 5 Growth & Decline Markets (by Value)
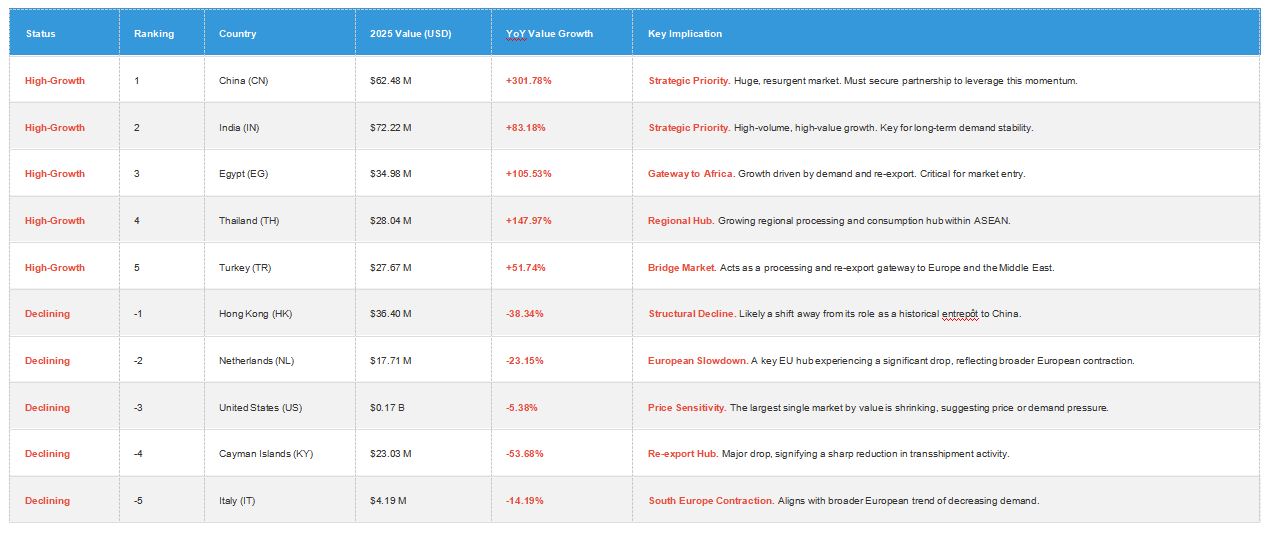
Partner Country Assessment:
·China: A Critical Growth Partner. The 302% growth is not just a statistic; it is a market signal. This partnership should be prioritized for long-term contracts and premium product lines.
·India: A Volume Anchor. The consistent growth makes India a reliable volume partner, crucial for maintaining production scale. The value growth is lower than China's, suggesting a more price-sensitive segment.
·Egypt & Turkey: Strategic Gateways. These countries are not just end-consumers. They are regional re-export hubs for Africa (Egypt) and Europe/Middle East (Turkey). Strengthening ties here provides access to wider networks.
·United States: A Value-at-Risk Partner. As the largest market, its decline is a major risk. This may be due to competition from other origins (e.g., Brazil, India) or changing consumer preferences. A dedicated strategy (e.g., organic, specialty grades) may be needed to stabilize this relationship.
3. Monthly Trends and Market Volatility
Table 3.1: Monthly Value & Volume for Major Markets (Illustrative - Top 3 by Value)
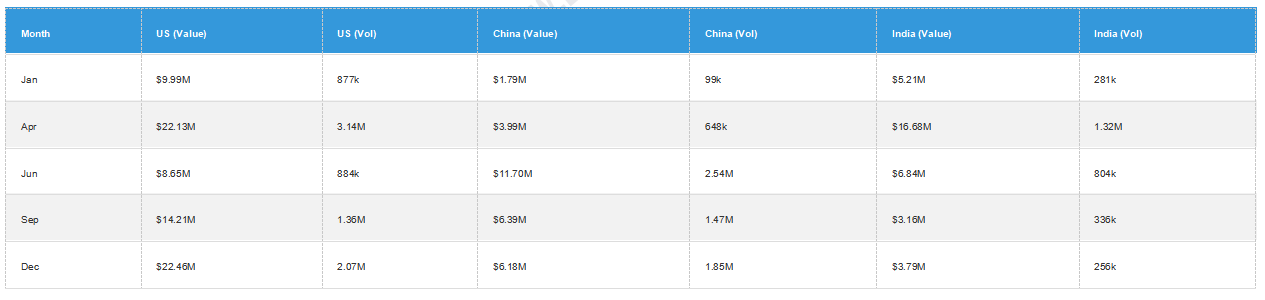
Analysis of Volatility:
·United States: Shows high intra-year volatility, peaking in April and December, which aligns with traditional import cycles. The Q3 decline is notable.
·China: The demand is heavily concentrated in Q2 (Apr-Jun), with a peak in June. This suggests a specific buying season (pre-monsoon or post-holiday restocking).
·India: Demand is also high in Q2 (April peak), then tapers off. This indicates a seasonal nature that can be planned for.
Implication: Inventory management must be agile, anticipating the Q2 peak demand from Asia (China & India) and the more evenly distributed, but larger, demand from the US.
4. Forecast and Strategic Recommendations
Forecast for 2026:
·Total Export Value: Likely to remain stable or see modest growth (5-10%), as high prices may temper volume growth in price-sensitive segments.
·Volume: The overall volume decline is expected to slow but may remain negative, driven by the structural shift away from low-value bulk exports.
·Market Shift:
·Asia (ex-China): Growth to continue, driven by India.
·China: Demand may stabilize after the 2025 surge. A 50-70% growth is still possible but will be more moderate.
·Africa: The high-growth trend is expected to continue, making it a key market for volume expansion.
·Americas: The US market may stabilize, while Latin America is expected to remain weak.
Strategic Recommendations for Stakeholders:
1.Adopt a Multi-Market Strategy:
·Tier 1 (Grow & Protect): China, India, UAE. Invest in direct partnerships, dedicated inventory, and brand-building. These are the future of the trade.
·Tier 2 (Develop): Egypt, Turkey, Morocco, Senegal. Establish distribution partnerships to penetrate the African and Middle Eastern markets. Offer competitive pricing and consistent supply to build trust.
·Tier 3 (Manage): USA, Germany, Netherlands. Focus on high-value segments (e.g., organic, fair-trade, specialty grades). Defend market share through quality and service rather than price. Actively seek partnerships centered on value-added processing.
2.Operate a Premium-Volume Dual Track:
·Premium Track: Focus on markets like the US, Europe, and high-end Asian markets where high prices are accepted. Emphasize quality, certification, and traceability.
·Volume Track: Service high-volume, emerging markets in Africa and price-sensitive segments in India with a leaner cost structure.
3.Enhance Supply Chain Agility:
·Use monthly trend data (Section 3) to align production and shipping schedules with peak demand seasons in China (Q2) and the US (Q2 & Q4).
·Develop flexible inventory models to avoid overstocking in slow months (e.g., Q3).
4.Mitigate Key Risks:
·Demand Concentration Risk: The strong reliance on China and India is a double-edged sword. A trade dispute or economic slowdown in either country would have a severe impact. Proactive diversification into Africa is the primary mitigation.
·Price Volatility Risk: The current high prices are a boon but may also be a ceiling that chokes off demand. Monitor price elasticity, especially in markets like India and Pakistan. Consider forward contracts to lock in margins for key partners.
·Geopolitical Risk: The decline in trade to Hong Kong and the Cayman Islands highlights how political shifts can eliminate major trade routes. Avoid over-dependence on any single transshipment hub.
Conclusion: The market for HS 09041120 is at a strategic inflection point. The low-volume, high-value trend is a positive sign of industry maturation. The winners in 2026 will be those who can successfully rebalance their market portfolio towards the high-growth engines of Asia and Africa while defending their position in mature markets through quality and partnership. The data strongly suggests that a strategy centered on a "China-India-Africa" corridor offers the highest probability of sustained long-term growth.