Executive Summary
Brazil imported approximately USD 628.36 million of lithium-ion batteries under HS 850760/85076000 in 2025, representing a 5.02% year-on-year decline. Import quantity fell more sharply, by 8.53% to about 70.10 million pieces, while the weighted average declared value increased 3.82% to USD 8.96 per piece. The market therefore displayed a clear “lower volume, higher average value” pattern.
Key Takeaways
·Asia remained the dominant sourcing region, accounting for 74.72% of import value, but its value and volume both declined by double digits.
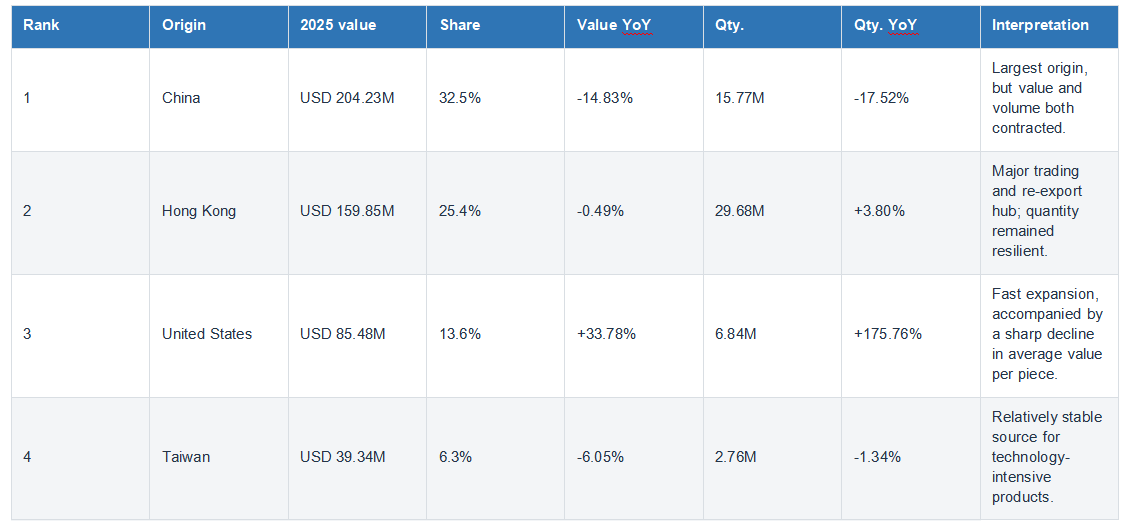
·China and Hong Kong together represented about 58% of Brazil’s import value, confirming continued dependence on Greater China-based supply chains and trading hubs.
·The United States was the fastest-growing major origin: import value increased 33.78% and quantity rose 175.76%, indicating a rapid expansion of lower average-value shipments.
·Brazil’s buyer base was concentrated: the ten largest importers represented approximately USD 245 million, or 39% of total import value.
·Demand was spread across electronics manufacturing, consumer devices, automotive applications, industrial equipment and energy-storage systems, creating wide differences in product specifications and declared unit values.
1. Market Snapshot
The 2025 data shows a moderate market contraction rather than a collapse. The decline in quantity was larger than the decline in value, lifting the average declared value per piece. This can reflect a richer product mix, higher specifications, price changes, or differences in the types of cells, modules and battery packs imported during the year.

2. Regional Supply Structure
Asia remained the center of Brazil’s lithium-ion battery supply chain, but its position weakened in 2025. North America and Europe expanded their share, while smaller regions recorded very high growth from low bases. The regional numbers indicate a more diversified sourcing environment, although the market is still heavily dependent on Asian production and trading networks.
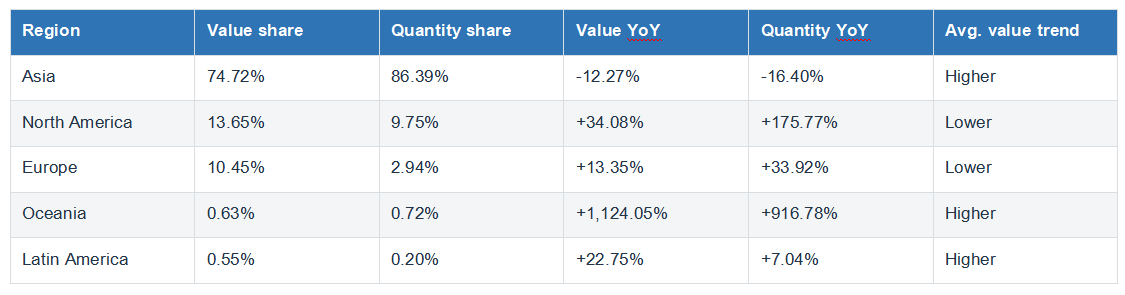
Asia: Import value fell 12.27% and quantity declined 16.40%. China was the largest contributor to the regional decrease, while Hong Kong remained comparatively stable as a trading hub.
North America: Value increased 34.08% and quantity rose 175.77%. The much faster growth in quantity indicates a lower average declared value and a significant change in product mix.
Europe: Both value and quantity increased, but quantity grew more quickly. European suppliers appear to be broadening their participation beyond only premium, low-volume products.
3. Leading Countries and Trading Hubs
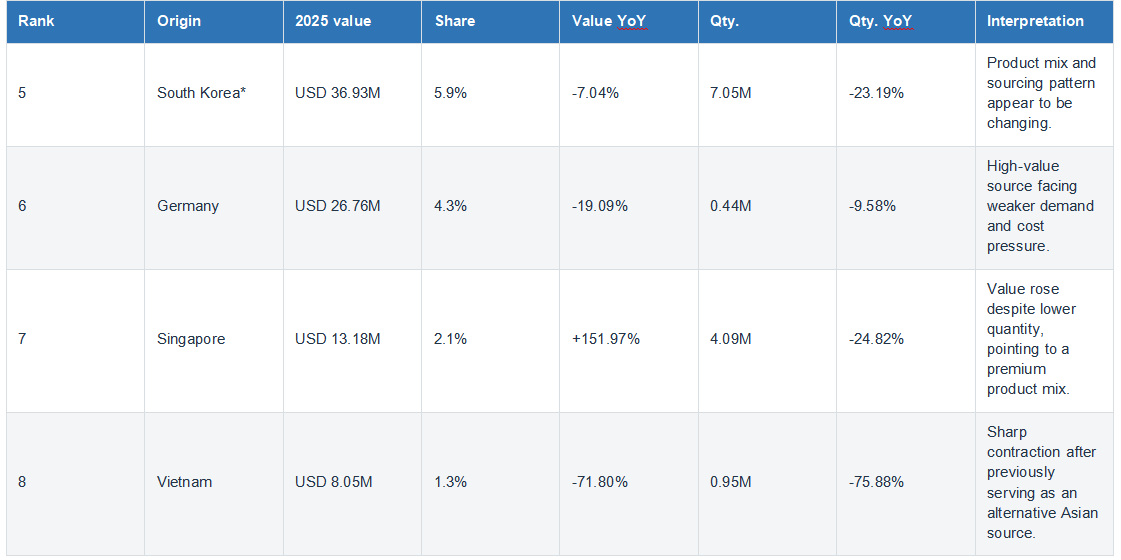
The eight origins below accounted for approximately 91.3% of Brazil’s 2025 import value. China remained the largest origin, while Hong Kong played an unusually large role as a sourcing and re-export hub. The United States recorded the strongest expansion among major origins.
4. Importer Structure and Market Concentration
Brazil’s lithium-ion battery market is concentrated but not homogeneous. The ten largest importers represented approximately USD 245 million, equivalent to 39% of total import value. The three leading importers — LIBRAPORT CAMPINAS S.A., SAMSUNG ELETRONICA DA AMAZONIA LTDA and INVENTUS POWER ELETRONICA DO BRASIL LTDA — together accounted for more than 15% of the market.
The importer base can be divided into four major groups:
·Electronics manufacturing services (EMS): Foxconn, Flextronics and Jabil import batteries and components for local assembly of phones, computers and other electronic devices.
·Consumer electronics brands: Samsung, Dell, Lenovo and Apple support local production, repair networks and finished-product demand.
·Automotive and mobility companies: BMW, Stellantis, BYD, BorgWarner and Toyota import higher-value battery systems, modules and related components for vehicles and mobility applications.
·Industrial and energy users: Acumuladores Moura, WEG, Eaton and other industrial companies source batteries for energy storage, backup power, tools and specialized equipment.
Supplier concentration is also important. LIBRAPORT was linked to only three suppliers, while Samsung used 22. These relationships indicate operational stability, but they can also expose buyers to disruption when a limited number of suppliers, factories or logistics routes account for a large share of procurement.
5. Product Mix and Price Segmentation
HS 850760 covers a broad range of lithium-ion products, from small cells for consumer electronics to vehicle battery modules and large industrial systems. As a result, declared value per piece and value per metric ton can differ dramatically between importers and transactions.
The data should not be interpreted through a single “high-price versus low-price” threshold. A more reliable comparison requires normalization by battery format, chemistry, capacity, voltage, pack configuration, application and trade terms. For example, an automotive battery pack may have a very high value per piece but a lower value per kilogram than a small, specialized electronics battery.
The most commercially relevant segmentation is therefore application-based:
·Consumer electronics and computing: high shipment frequency, standardized specifications and strong sensitivity to product cycles.
·Automotive and mobility: lower shipment frequency but higher transaction value, stricter safety requirements and longer qualification cycles.
·Industrial and energy storage: project-based demand, wider variation in capacity and configuration, and greater importance of system integration and after-sales support.
·Trading and distribution: large consolidated shipments, fewer declared suppliers and a greater need to identify the ultimate buyer and end-use market.
6. Supply-Chain and Transaction Signals
Transaction frequency helps reveal the operating model behind the imports. Dell recorded approximately 5,055 transactions and Samsung about 3,238, consistent with frequent replenishment and just-in-time production. LIBRAPORT and Foxconn also showed regular shipment activity, reflecting the requirements of contract manufacturing and local assembly.
In contrast, automotive and industrial buyers often place fewer but significantly higher-value orders. This pattern is consistent with project-based procurement, production launches or imports of complete modules and systems. Trading companies such as BRAZIL GOODTRADE and COMEXPORT can also appear with large volumes but a limited supplier base, making shipment-level buyer and supplier mapping essential.
7. Market Risks and Opportunities
Key Risks
·Concentration risk: China and Hong Kong represented approximately 58% of import value. Disruption in these supply routes would have an immediate market impact.
·Product-comparability risk: average prices can be misleading when cells, modules and complete packs are mixed under the same HS heading.
·Sustainability of new supply growth: rapid expansion from the United States and smaller origins should be tested for consistency, supplier depth and repeat shipment behavior.
·Technology and compliance risk: battery chemistry, safety standards, recycling rules and transport requirements continue to affect qualification and landed cost.
·Trade-flow diversion risk: tariff and industrial-policy changes in major markets can redirect excess supply toward Latin America, increasing both sourcing options and price pressure.
Commercial Opportunities
·Supplier diversification: Brazilian buyers can use the current shift to negotiate alternative sources and reduce single-country exposure.
·High-value applications: automotive electrification, backup power and energy storage create demand for safer, higher-performance batteries and integrated systems.
·Competitor replacement: importers with concentrated supplier portfolios are attractive targets for qualified alternative suppliers.
·Local assembly and localization: rising imports by automotive, electronics and battery companies can indicate new production lines, capacity expansion or local sourcing programs.
·Data-driven pricing: shipment-level comparisons can identify large differences in unit value among suppliers serving similar buyers and applications.
8. Strategic Recommendations
Adopt a 3A Sourcing Strategy
·Asia — protect the core: maintain strategic relationships with China, Hong Kong, Taiwan, South Korea and Singapore, while improving contract flexibility and dual-sourcing critical products.
·Americas — develop alternatives: evaluate the expanding United States supply base and regional partners for shorter lead times, diversification and technical cooperation.
·Alternatives — test emerging sources: monitor Europe and smaller origins through trial orders, quality checks and repeat-shipment analysis before allocating major volumes.
Build a Dynamic Market-Monitoring Model
·Track monthly changes in value, quantity, average declared value and shipment frequency by origin, importer and supplier.
·Create alerts for new suppliers, sudden price changes, lost customers, unusually large shipments and changes in competitor activity.
·Separate cells, modules and complete battery packs wherever product descriptions allow, so that price comparisons are commercially meaningful.
·Map importer-supplier relationships to identify buyers with high supplier concentration, multi-sourcing behavior or visible replacement opportunities.
9. How Big Trade Data Supports Battery-Market Intelligence
Big Trade Data transforms customs transactions into practical sales and supply-chain intelligence. Companies operating in the lithium-ion battery industry can use the platform to:
·Identify active Brazilian importers and verify their real purchasing behavior.
·Track the suppliers serving each buyer and measure supplier concentration.
·Compare declared prices, quantities and product descriptions across competing sources.
·Monitor competitors’ customer portfolios, shipment frequency and market-entry activity.
·Evaluate country-level demand, sourcing shifts and emerging trade routes.
·Generate targeted prospect lists and prioritize accounts with clear purchasing or supplier-change signals.
For suppliers, traders, investors and market-development teams, the strongest opportunities are not found only in market totals. They are found in the transaction-level relationships between buyers, suppliers, product specifications and prices.
Conclusion
Brazil’s lithium-ion battery import market entered a period of structural adjustment in 2025. Total value and quantity declined, but the market became more diversified and the average declared value increased. Asia continued to dominate, while the United States and Europe gained ground. At the buyer level, demand remained concentrated among electronics manufacturers, automotive companies, industrial users and major trading platforms.
The next stage of competition will depend on supplier diversification, product specialization, localization and the ability to identify changes in buyer behavior early. Companies that monitor transaction-level data — rather than relying only on aggregate statistics — will be better positioned to protect key accounts, identify replacement opportunities and build a more resilient market strategy in Brazil.